Suggestions for Design of
|
|
|||||||||||||||||||||||||||||||||||
|
Under the Everglades Construction Project (ECP), six Stormwater Treatment Areas (STA's) are being constructed to reduce phosphorus loads in agricultural runoff and releases from Lake Okeechobee prior to discharge into the Water Conservation Areas. The STA's are designed to achieve a long-term, flow-weighted-mean outflow concentration of 50 ppb or less. While the treatment concept does not include management to encourage specific vegetation types, STA's are likely to be dominated by rooted macrophytes. The ultimate goal of the program is to achieve water quality standards by 2007. Discharge concentrations well below 50 ppb will probably be necessary to achieve this goal. Ultimate treatment requirements will reflect numeric phosphorus criteria currently being developed by the Florida Department of Environmental Protection. Several technologies are being investigated to accomplish further reductions in phosphorus. A target outflow concentration of 10 ppb is assumed in evaluating these technologies. Existing data indicate that it will be difficult to achieve outflow concentrations less than 20-30 ppb with macrophyte-based STA's. The advanced treatment technologies being investigated include various combinations of physical, chemical, & biological processes. Among these is the concept of designing & managing the treatment areas to promote growth of periphyton and/or submersed aquatic vegetation (SAV) relative to macrophytes. The acronym "PSTA" has been coined to represent a stormwater treatment area dominated by periphyton. Workshops were held December 3-6, 1999 to review initial results of research teams investigating the SAV & PSTA concepts and to refine plans for future research. The following comments & suggestions are are based upon review of current results, field observations, & workshop discussions. Generally, the research programs are addressing various scientific (process-oriented) and engineering (performance-oriented) aspects. My comments focus on the latter, specifically characterization of overall performance in relation to hydraulic characteristics and estimation of parameters that would be needed to design and manage a full-scale treatment system. While models of various complexity are being developed, an initial goal is to modify and/or recalibrate the STA design model to reflect these alternative vegetation types. Attached graphs summarize initial (~first year) results of tests conducted by the PSTA & SAV research teams at the south end of the Everglades Nutrient Removal Project. Results for ENRP Cell 4 (SAV dominated) are also shown. Performance is expressed in terms of areal P uptake (g/m2-yr), first-order settling rate (m/yr), and outflow concentration (ppb). Each performance indicator is plotted against the following factors: SAV & PSTA results are derived from reports submitted by research teams to SFWMD. ENRP results are derived from analysis of SFWMD monitoring data. For the following reasons, apparent correlations in some of these plots do not necessarily reflect causal relationships:
Additional research and modeling are needed to sort out causal factors. The following table compares experimental regimes with those expected for a full-scale system meeting the treatment objective:
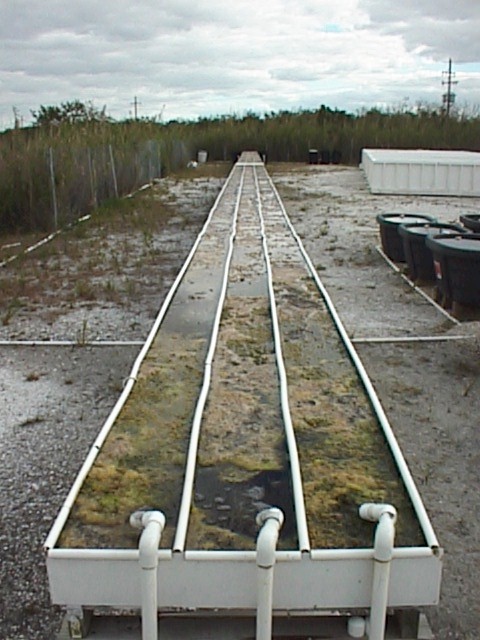
Phase I experiments have focused more on replicating depth & residence time than on replicating velocity. Only the raceways operated by the SAV research team had velocities approaching those expected in STA's or reasonable extensions thereof ( roughly 0.2-0.5 cm/sec at average flow to 0.8-1.6 cm/sec at maximum monthly flow) or those present in Cell 4 of the ENRP (averaging 0.6 cm/sec). Velocity estimates for STA's are based upon simulations conducted under the Corps Restudy. The raceways are dominated by periphyton & depths (< 2-9 cm) well below those expected in full-scale treatment areas when they are discharging (45 to 120 cm). Consider these hypotheses regarding velocity effects etc:
The SAV-dominated Cell 4 is the only "experiment" conducted in representative depth and velocity regimes. Unfortunately, Cell 4, like most of the other experiments, does not achieve a 10 ppb outflow concentration. Only the low-velocity raceway achieved 10 ppb, but at an unrealistically shallow depth (9 cm). Low velocities in the mesocosms reflect the fact that they were designed to provide residence times of 1.5 -7 days with short flow-path lengths. These HRT's (or equivalent water loads) are required to provide a measureable concentration reduction between the inflow & outflow. One possible way of generating a representative flow velocity in the mesocosm tanks while satisfying depth & water load constraints would be to recirculate the flow (as suggested by R. Knight). This seems to be worth trying because it can be done relatively easily and quickly, assuming that the mesocosm does not have to be started from scratch. Difficulties in replicating vertical velocity profiles typical of marsh areas will, however, add to the list of potential artifacts associated with the small-scale experiments. Tests on a larger scale seem essential; these will require long flow path lengths in order to achieve the desired flow velocities. A spreadsheet that demonstrates how scaling factors can be considered in experimental design is attached. On another note.. I am concerned that inflows to the ENRP test cells are apparently being monitored by SFWMD and/or contract labs, while the outflows are being monitored by the individual research teams. Everglades Round Robin results demonstrate why this is a scary situation. Despite the best QA/QC efforts, there is a high risk of systematic differences in low-level phosphorus analyses across labs. These differences drift over time & cannot be controlled by increasing sampling frequencies (i.e. accuracy problem, not precision problem). Inflow and outflow samples should be collected simultaneously and analyzed by the SFWMD lab (as discussed extensively and recommended by ETAC). Otherwise, the inflow/outflow comparisons, as well as the across-treatment comparisons could be in error by 50% or more in these low concentration ranges. QA/QC procedures should include routine split samples with the FDEP lab, which seems to give the most consistent results, based upon the Round Robin. The other problem with the monitoring protocol is that SAV/PSTA projects are collecting weekly grab samples to characterize inflow & outflow concentrations. Research teams investigating physical/chemical treatment processes are collecting daily inflow & outflow composite samples. Existing STA discharge permits require weekly composite samples. Composite samplers are also being used to monitor ENRP inflows, internal culverts, and outflows. I recommend that weekly composite samples be collected at the inflows & outflows of larger-scale experiments. Weekly grabs should also be collected to compare sampling techniques and provide data in the event of auto-sampler failure. Since the marsh threshold is likely to be expressed as a geometric mean, it seems appropriate to report geometric mean outflow concentrations (not flow weighted) for experimental systems, in addition to flow-weighted means. The latter is the primary performance measure, however. W. Walker DOI Projects Home Page E-Mail http:/www.wwwalker.net/sav-psta/index.htm 03/04/05 |
||||||||||||||||||||||||||||||||||||