| Summary of Long-Term Water Quality
Monitoring Data from White Pond |
| Concord,
Massachusetts |
| William W.
Walker, Jr. Ph.D, Environmental Engineer |
| 07/17/17 |
|
|
|
|
|
|
|
|
|
|
|
|
|
|
|
|
|
|
|
|
|
|
|
|
|
|
|
|
|
|
|
|
|
|
|
|
|
|
|
|
|
|
|
|
|
|
|
|
|
|
|
|
|
|
|
|
|
|
|
|
|
|
|
|
|
|
|
|
|
|
|
|
|
|
|
|
|
|
|
|
|
|
|
|
|
|
|
|
|
|
|
|
|
|
|
|
|
|
|
|
|
|
|
|
|
|
|
|
|
|
|
|
|
|
|
|
|
|
|
|
|
|
|
|
|
|
|
|
|
|
|
|
|
|
|
|
|
|
|
|
|
|
|
|
|
|
|
|
|
|
|
|
|
|
|
|
|
|
|
|
|
|
|
|
|
|
|
|
|
|
|
|
|
|
|
|
|
|
|
|
| Introduction |
Water Level Fluctuations |
Long-Term Trends in Transparency |
Transparency vs. Precipitation |
| Climate
Change |
Proposed Restoration Goal |
Analysis of Temperature & Dissolved Oxygen Profiles |
|
Phosphorus Data |
| Potential
Remedy for Sediment Phosphorus Releases |
|
References |
Friends of White Pond - Ponderings
2015 |
| Google Map |
|
|
|
|
|
|
|
|
|
|
|
|
|
|
|
|
|
|
|
|
|
|
|
|
|
|
|
|
|
|
|
|
|
|
|
|
|
|
|
|
|
|
|
|
|
|
|
|
|
|
|
|
|
|
|
|
|
|
|
|
|
|
|
|
|
|
|
|
|
|
|
|
|
|
|
|
|
|
|
|
|
|
|
|
|
|
|
|
|
|
|
|
|
|
|
|
|
|
|
|
|
|
|
|
|
|
|
|
|
|
|
|
|
|
|
|
|
|
|
|
|
|
|
|
|
|
|
|
|
|
|
|
|
|
|
|
|
|
|
|
|
|
|
|
|
|
|
|
|
|
|
|
|
|
|
|
|
|
|
|
|
|
|
|
|
|
| Google Group for Public Input |
|
|
Photo & Video Cache |
|
|
Latest News |
|
| June-July 2015 Bloom - Linked In |
|
|
Document Cache |
|
|
2015 Bloom Photos |
|
| 2017 Bloom Photos |
|
|
|
|
|
|
|
|
|
|
|
|
|
|
|
|
|
|
|
|
|
|
| Introduction |
|
|
|
|
|
|
|
|
|
|
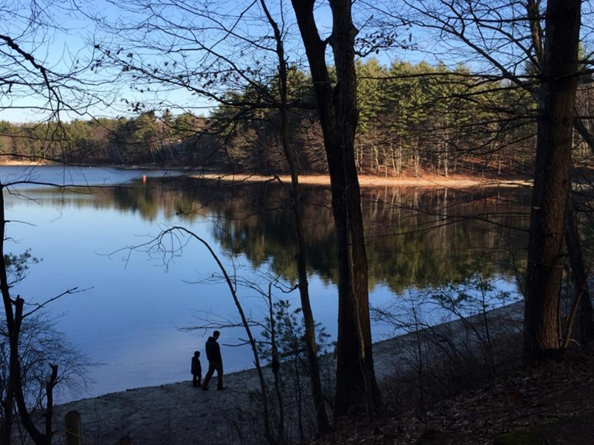
| Following is a
summary of the historical transparency and water level data collected by the
Friends of White Pond between 1987 and 2013. |
| Supports
Concord's current efforts to develop a management plan to restore &
protect water quality and ecology. |
|
|
| The Concord
Board of Selectmen Has Scheduled a Town Forum on White Pond, Harvey Wheeler Center, 6:45 pm, January 21,
2015. |
|
|
|
|
|
|
|
|
|
|
|
|
| Water Level Fluctuations |
|
|
|
|
|
|
|
|
|
|
|
|
|
|
|
|
|
|
|
|
|
|
|
|
|
|
|
|
|
|
|
|
|
|
|
|
|
|
|
|
|
|
|
|
|
|
|
|
|
|
|
|
|
|
|
|
|
|
|
|
|
|
|
|
|
|
|
|
|
|
|
|
|
|
|
|
|
|
|
|
|
|
|
|
|
|
|
|
|
|
|
|
|
|
|
|
|
|
|
|
|
|
|
|
|
|
|
|
|
|
|
|
|
|
|
|
|
|
|
|
|
|
|
|
|
|
|
|
|
|
|
|
|
|
|
|
|
|
|
|
|
|
|
|
|
|
|
|
|
|
|
|
|
|
|
|
|
|
|
|
|
|
|
|
|
|
|
|
|
|
|
|
|
|
|
|
|
|
|
|
|
|
|
|
|
|
|
|
|
|
|
|
|
|
|
|
|
|
|
|
|
|
|
|
|
|
|
|
|
|
|
|
|
|
|
|
|
|
|
|
|
|
|
|
|
|
|
|
|
|
|
|
|
|
|
|
|
|
|
|
|
|
|
|
|
|
|
|
|
|
|
|
|
|
|
|
|
|
|
|
|
|
|
|
|
|
|
|
|
|
|
|
|
|
|
|
|
|
|
|
|
|
|
|
|
|
|
|
|
|
|
|
|
|
|
|
|
|
|
|
|
|
|
|
|
|
|
|
|
|
|
|
|
|
|
|
|
|
|
|
|
|
|
|
|
|
|
|
|
|
|
|
|
|
|
|
|
|
|
|
|
|
|
|
|
|
|
|
|
|
|
|
|
|
|
|
|
|
|
|
|
|
|
|
|
|
|
|
|
|
|
|
|
|
|
|
|
|
|
|
|
|
|
|
|
|
|
|
|
|
|
|
|
|
|
|
|
|
|
|
|
|
|
|
|
|
|
|
|
|
|
|
|
|
|
|
|
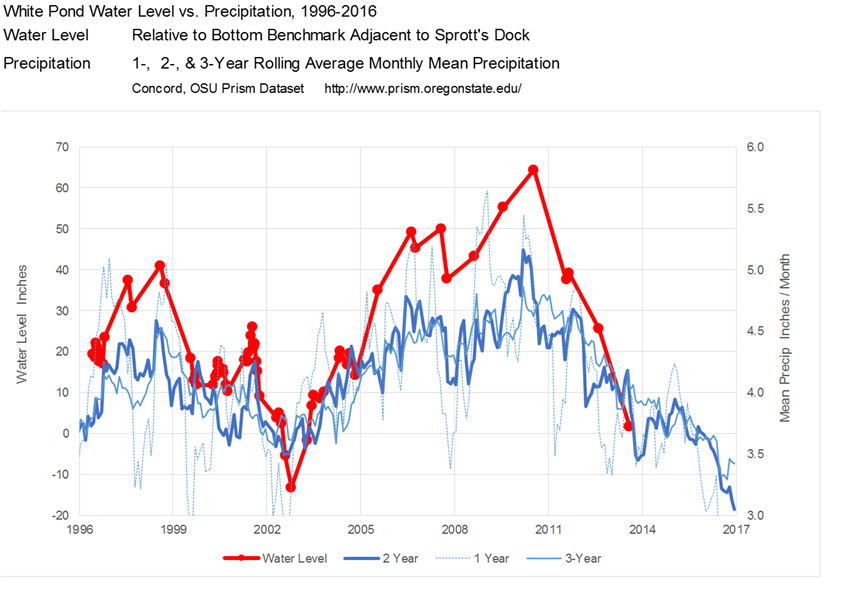
| Historical
water levels varied over a range of approximately 60 inches ( 5 feet ),
relative to the maximum depth of ~55 feet. |
|
| Variations in
water levels are highly correlated with variations in precipitation averaged
over 2-3 year period. |
|
|
| The lag time
likely reflects the large volume of groundwater storage and slow discharge
rates from the aquifer to downstream waterbodies. |
| The recent low
water levels are explained by low precipitation, although increased pumping
from the town well could also be a factor. |
| Water levels in
Walden Pond are also very low, although time series data are not available. |
|
|
|
|
|
|
|
|
|
|
|
|
|
|
|
|
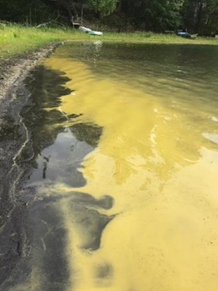
| The pond is
more susceptable to effects of runoff and erosion from shoreline areas during
periods of high rainfall and water level. |
|
| When water
levels are low, some of the eroded materials from the watershed could be
trapped in the beach area and not reach the pond. |
| When water
levels are high, watershed loads are more likely to reach the pond and wave
action could contribute to erosion of the banks. |
|
|
|
|
|
|
|
|
|
|
|
|
| When water
levels are lower, the assimilative capacity of the pond to handle a given
phosphorus load is lower. |
|
|
| The rate of
oxygen depletion in the bottom waters would also tend to be higher in
shallower years because of the smaller volume. |
|
| This could
have adverse impacts on the fish habitat and increase the rate of phosphorus
release from the pond bottom sediments. |
|
|
|
|
|
|
|
|
|
|
|
|
| Long-Term Trends in Transparency & Turbidity |
|
|
|
|
|
|
|
|
|
|
|
|
|
|
|
|
|
|
|
|
|
|
|
|
|
|
|
|
|
|
|
|
|
|
|
|
|
|
|
|
|
|
|
|
|
|
|
|
|
|
|
|
|
|
|
|
|
|
|
|
|
|
|
|
|
|
|
|
|
|
|
|
|
|
|
|
|
|
|
|
|
|
|
|
|
|
|
|
|
|
|
|
|
|
|
|
|
|
|
|
|
|
|
|
|
|
|
|
|
|
|
|
|
|
|
|
|
|
|
|
|
|
|
|
|
|
|
|
|
|
|
|
|
|
|
|
|
|
|
|
|
|
|
|
|
|
|
|
|
|
|
|
|
|
|
|
|
|
|
|
|
|
|
|
|
|
|
|
|
|
|
|
|
|
|
|
|
|
|
|
|
|
|
|
|
|
|
|
|
|
|
|
|
|
|
|
|
|
|
|
|
|
|
|
|
|
|
|
|
|
|
|
|
|
|
|
|
|
|
|
|
|
|
|
|
|
|
|
|
|
|
|
|
|
|
|
|
|
|
|
|
|
|
|
|
|
|
|
|
|
|
|
|
|
|
|
|
|
|
|
|
|
|
|
|
|
|
|
|
|
|
|
|
|
|
|
|
|
|
|
|
|
|
|
|
|
|
|
|
|
|
|
|
|
|
|
|
|
|
|
|
|
|
|
|
|
|
|
|
|
|
|
|
|
|
|
|
|
|
|
|
|
|
|
|
|
|
|
|
|
|
|
|
|
|
|
|
|
|
|
|
|
|
|
|
|
|
|
|
|
|
|
|
|
|
|
|
|
|
|
|
|
|
|
|
|
|
|
|
|
|
|
|
|
|
|
|
|
|
|
|
|
|
|
|
|
|
|
|
|
|
|
|
|
|
|
|
|
|
|
|
|
|
|
|
|
|
|
|
|
|
|
|
|
|
|
|
|
|
|
|
|
|
|
|
|
|
|
|
|
|
|
|
|
|
|
|
|
|
|
|
|
|
|
|
|
|
|
|
|
|
|
|
|
|
|
|
|
|
|
|
|
|
|
|
|
|
|
|
|
|
|
|
|
|
|
|
|
|
|
|
|
|
|
|
|
|
|
|
|
|
|
|
|
|
|
|
|
|
|
|
|
|
|
|
|
|
|
|
|
|
|
|
|
|
|
|
|
|
|
|
|
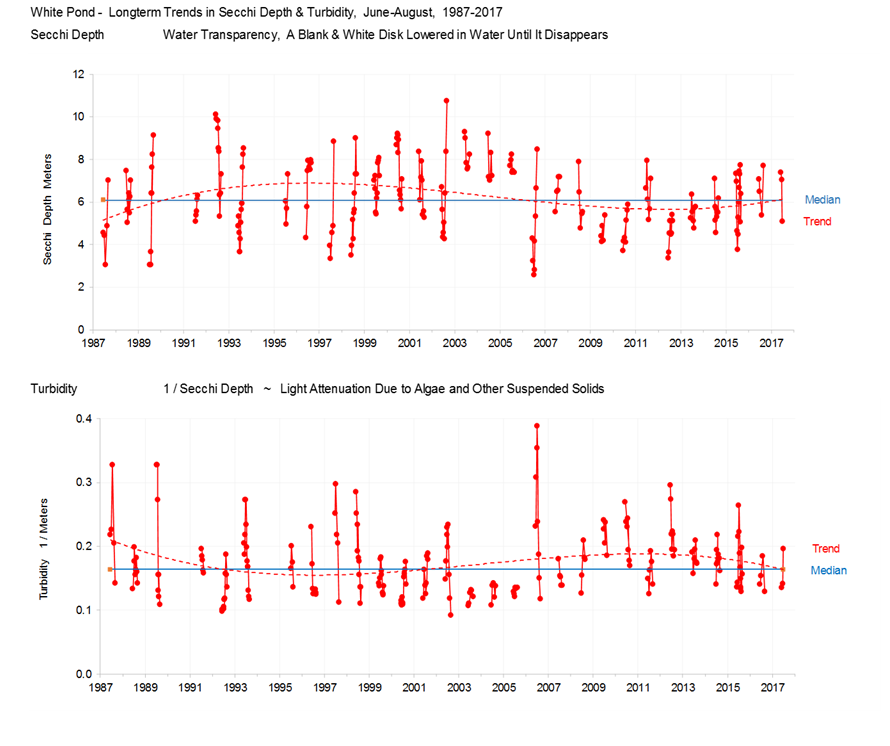
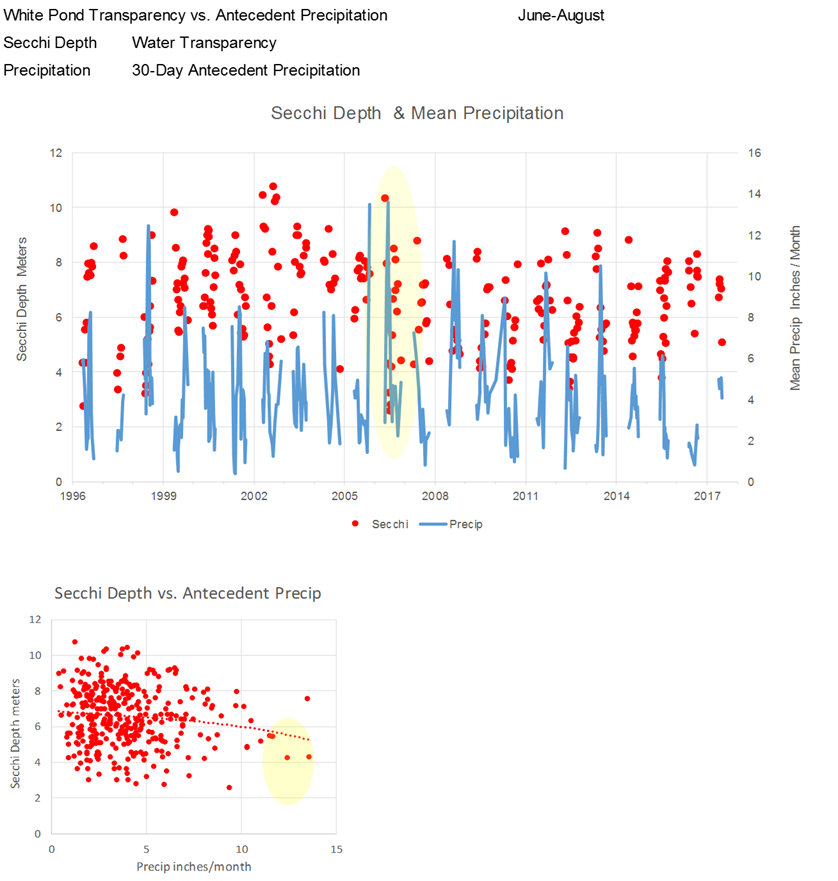
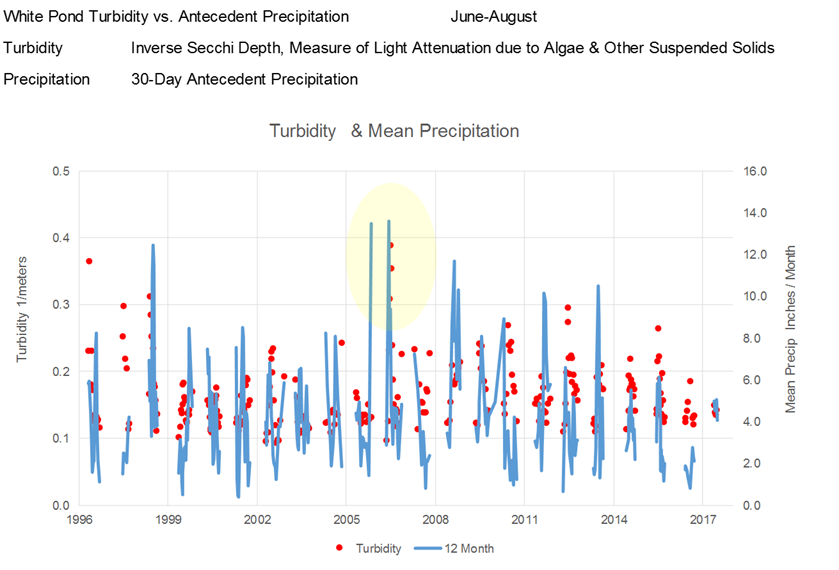
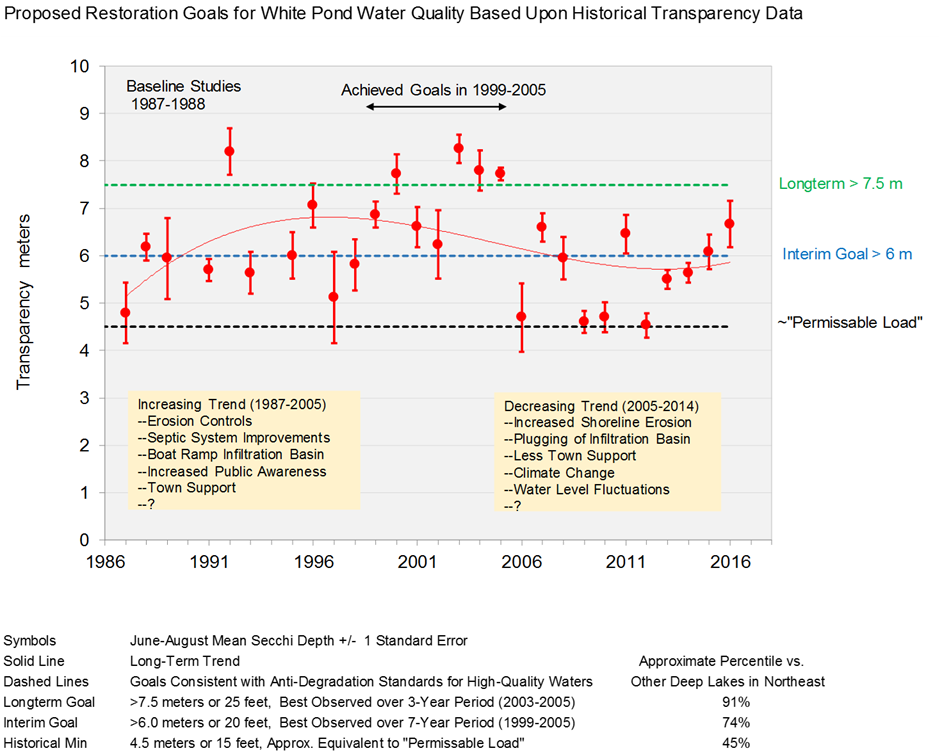
| Water clarity
apparently improved over the 1987-2005 period (Secchi depth increased,
turbidity decreased). |
|
|
| The
improvements are possibly related to management measures taken after the
1987-1988 baseline study. |
|
|
| Measures
included construction of an infiltration basin at the base of the boat ramp,
improvements to shoreline septic systems, etc. |
| The improving
trend was reversed around 2005. Secchi
depths were generally below the long-term median (~ 6 meters) in 2009-2014 |
| The lower
water clarity in recent years is consistent with increasing erosion at
several locations around the shoreline and plugging |
| of the
infiltration basin due to inadequate maintenance. |
( see plans & photos ) |
|
|
|
|
|
| Water clarity
improved slightly in 2015-2017. This
could reflect lower precipitation rates and repair of the infiltration basin
in 2016. |
|
|
|
|
|
|
|
|
|
|
|
|
| Transparency & Turbidity vs. Antecedent Precipitation |
|
|
|
|
|
|
|
|
|
|
|
|
|
|
|
|
|
|
|
|
|
|
|
|
|
|
|
|
|
|
|
|
|
|
|
|
|
|
|
|
|
|
|
|
|
|
|
|
|
|
|
|
|
|
|
|
|
|
|
|
|
|
|
|
|
|
|
|
|
|
|
|
|
|
|
|
|
|
|
|
|
|
|
|
|
|
|
|
|
|
|
|
|
|
|
|
|
|
|
|
|
|
|
|
|
|
|
|
|
|
|
|
|
|
|
|
|
|
|
|
|
|
|
|
|
|
|
|
|
|
|
|
|
|
|
|
|
|
|
|
|
|
|
|
|
|
|
|
|
|
|
|
|
|
|
|
|
|
|
|
|
|
|
|
|
|
|
|
|
|
|
|
|
|
|
|
|
|
|
|
|
|
|
|
|
|
|
|
|
|
|
|
|
|
|
|
|
|
|
|
|
|
|
|
|
|
|
|
|
|
|
|
|
|
|
|
|
|
|
|
|
|
|
|
|
|
|
|
|
|
|
|
|
|
|
|
|
|
|
|
|
|
|
|
|
|
|
|
|
|
|
|
|
|
|
|
|
|
|
|
|
|
|
|
|
|
|
|
|
|
|
|
|
|
|
|
|
|
|
|
|
|
|
|
|
|
|
|
|
|
|
|
|
|
|
|
|
|
|
|
|
|
|
|
|
|
|
|
|
|
|
|
|
|
|
|
|
|
|
|
|
|
|
|
|
|
|
|
|
|
|
|
|
|
|
|
|
|
|
|
|
|
|
|
|
|
|
|
|
|
|
|
|
|
|
|
|
|
|
|
|
|
|
|
|
|
|
|
|
|
|
|
|
|
|
|
|
|
|
|
|
|
|
|
|
|
|
|
|
|
|
|
|
|
|
|
|
|
|
|
|
|
|
|
|
|
|
|
|
|
|
|
|
|
|
|
|
|
|
|
|
|
|
|
|
|
|
|
|
|
|
|
|
|
|
|
|
|
|
|
|
|
|
|
|
|
|
|
|
|
|
|
|
|
|
|
|
|
|
|
|
|
|
|
|
|
|
|
|
|
|
|
|
|
|
|
|
|
|
|
|
|
|
|
|
|
|
|
|
|
|
|
|
|
|
|
|
|
|
|
|
|
|
|
|
|
|
|
|
|
|
|
|
|
|
|
|
|
|
|
|
|
|
|
|
|
|
|
|
|
|
|
|
|
|
|
|
|
|
|
|
|
|
|
|
|
|
|
|
|
|
|
|
|
|
|
|
|
|
|
|
|
|
|
|
|
|
|
|
|
|
|
|
|
|
|
|
|
|
|
|
|
|
|
|
|
|
|
|
|
|
|
|
|
|
|
|
|
|
|
|
|
|
|
|
|
|
|
|
|
|
|
|
|
|
|
|
|
|
|
|
|
|
|
|
|
|
|
|
|
|
|
|
|
|
|
|
|
|
|
|
|
|
|
|
|
|
|
|
|
|
|
|
|
|
|
|
|
|
|
|
|
|
|
|
|
|
|
|
|
|
|
|
|
|
|
|
|
|
|
|
|
|
|
|
|
|
|
|
|
|
|
|
|
|
|
|
|
|
|
|
|
|
|
|
|
|
|
|
|
|
|
|
|
|
|
|
|
|
|
|
|
|
|
|
|
|
|
|
|
|
|
|
|
|
|
|
|
|
|
|
|
|
|
|
|
|
|
|
|
|
|
|
|
|
|
|
|
|
|
|
|
|
|
|
|
|
|
|
|
|
|
|
|
|
|
|
|
|
|
|
|
|
|
|
|
|
|
|
|
|
|
|
|
|
|
|
|
|
|
|
|
|
|
|
|
|
|
|
|
|
|
|
|
|
|
|
|
|
|
|
|
|
|
|
|
|
|
|
|
|
|
|
|
|
|
|
|
|
|
|
|
|
|
|
|
|
|
|
|
|
|
|
|
|
|
|
|
|
|
|
|
|
|
|
|
|
|
|
|
|
|
|
|
|
|
|
|
|
|
|
|
|
|
|
|
|
|
|
|
|
|
|
|
|
|
|
|
|
|
|
|
|
|
|
|
|
|
|
|
|
|
|
|
|
|
|
|
|
|
|
|
|
|
|
|
|
|
|
|
|
|
|
|
|
|
|
|
|
|
|
|
|
|
|
|
|
|
|
|
|
|
|
|
|
|
|
|
|
|
|
|
|
|
|
|
|
|
|
|
|
|
|
|
|
|
|
|
|
|
|
|
|
|
|
|
|
|
|
|
|
|
|
|
|
|
|
|
|
|
|
|
|
|
|
|
|
|
|
|
|
|
|
|
|
|
|
|
|
|
|
|
|
|
|
|
|
|
|
|
|
|
|
|
|
|
|
|
|
|
|
|
|
|
|
|
|
|
|
|
|
|
|
|
|
|
|
|
|
|
|
|
|
|
|
|
|
|
|
|
|
|
|
|
|
|
|
|
|
|
|
|
|
|
|
|
|
|
|
|
|
|
|
|
|
|
|
|
|
|
|
|
|
|
|
|
|
|
|
|
|
|
|
|
|
|
|
|
|
|
|
|
|
|
|
|
|
|
|
|
|
|
|
|
|
|
|
|
|
|
|
|
|
|
|
|
|
|
|
|
|
|
|
|
|
|
|
|
|
|
|
|
|
|
|
|
|
|
|
|
|
|
|
|
|
|
|
|
|
|
|
|
|
|
|
|
|
|
|
|
|
|
|
|
|
|
|
|
|
|
|
|
|
|
|
|
|
|
|
|
|
|
|
|
|
|
|
|
|
|
|
|
|
|
|
|
|
|
|
|
|
|
|
|
|
|
|
|
|
|
|
|
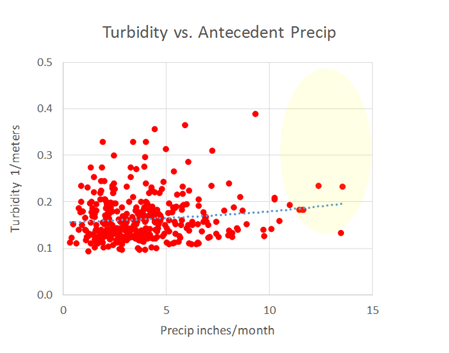
| The charts
above show that significant decreases in water clarity were associated with
high precipitation in May of 2006. |
|
| This was the
infamous "Mother's Day Storm" that totaled about 7 inches on May
12-15. |
Wiki Description |
NOAA Record |
| Secchi depth
decreased from 10.3 meters
(~historical high) on May 7, to 8.0 meters on May 25, and 2.6 meters
on June 30 (~historical low). |
|
|
|
|
|
|
|
|
|
|
|
|
| A single
erosion event associated with extreme rainfall could have a long-term impact
on both the watershed and the pond. |
|
| Unless
repaired, gullies created in the steep shoreline banks would be more
susceptable to erosion in subsequent smaller storms. |
| Nutrient loads discharged into the pond during runoff events are
stored and recycled within the pond, so we would not expect a 1/1
relationship between precipitation and clarity in each year. |
|
|
|
|
|
|
|
|
|
|
|
|
| Climate Change |
|
|
|
|
|
|
|
|
|
|
|
|
|
|
|
|
|
|
|
|
|
|
|
|
|
|
|
|
|
|
|
|
|
|
|
|
|
|
|
|
|
|
|
|
|
|
|
|
|
|
|
|
|
|
|
|
|
|
|
|
|
|
|
|
|
|
|
|
|
|
|
|
|
|
|
|
|
|
|
|
|
|
|
|
|
|
|
|
|
|
|
|
|
|
|
|
|
|
|
|
|
|
|
|
|
|
|
|
|
|
|
|
|
|
|
|
|
|
|
|
|
|
|
|
|
|
|
|
|
|
|
|
|
|
|
|
|
|
|
|
|
|
|
|
|
|
|
|
|
|
|
|
|
|
|
|
|
|
|
|
|
|
|
|
|
|
|
|
|
|
|
|
|
|
|
|
|
|
|
|
|
|
|
|
|
|
|
|
|
|
|
|
|
|
|
|
|
|
|
|
|
|
|
|
|
|
|
|
|
|
|
|
|
|
|
|
|
|
|
|
|
|
|
|
|
|
|
|
|
|
|
|
|
|
|
|
|
|
|
|
|
|
|
|
|
|
|
|
|
|
|
|
|
|
|
|
|
|
|
|
|
|
|
|
|
|
|
|
|
|
|
|
|
|
|
|
|
|
|
|
|
|
|
|
|
|
|
|
|
|
|
|
|
|
|
|
|
|
|
|
|
|
|
|
|
|
|
|
|
|
|
|
|
|
|
|
|
|
|
|
|
|
|
|
|
|
|
|
|
|
|
|
|
|
|
|
|
|
|
|
|
| National
Climatic Data Center |
http://www.ncdc.noaa.gov/monitoring-references/maps/us-climate-divisions.php |
|
|
|
|
|
|
|
|
|
|
|
|
|
|
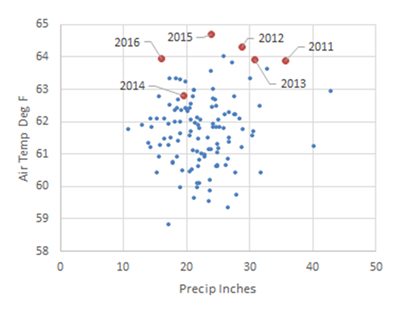
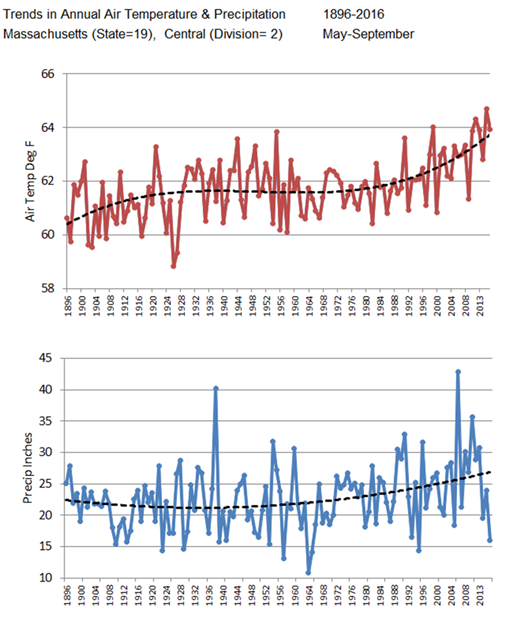
| Long-term
climate records indicate increasing trends in air temperature and
precipitation, particularly after 1960. |
|
|
| Increases in
air (hence water) temperature would have an adverse impact on the cold-water
fish habitat and increase algal growth rates. |
| By increasing
evapotranspiration from the watershed, warmer conditions would to tend to
reduce groundwater levels, pond inflows, |
| and pond water
levels, especially in drier years.
Pumping rate from the town well could also increase because of
increased demand. |
| Increases in
the mean and variability in precipitation would trigger increases in runoff,
erosion, and higher water levels. |
|
| These results point to the importance of controlling erosion
from the adjacent watershed to maintain existing water quality, particularly
given the expected increase in the lake user population associated with the
Bruce Freeman Railtral and the obvious evidence of erosion at several
locations around the pond. |
|
|
|
|
|
|
|
|
|
|
|
|
| Restoration Goal |
|
|
|
|
|
|
|
|
|
|
|
|
|
|
|
|
|
|
|
|
|
|
|
|
|
|
|
|
|
|
|
|
|
|
|
|
|
|
|
|
|
|
|
|
|
|
|
|
|
|
|
|
|
|
|
|
|
|
|
|
|
|
|
|
|
|
|
|
|
|
|
|
|
|
|
|
|
|
|
|
|
|
|
|
|
|
|
|
|
|
|
|
|
|
|
|
|
|
|
|
|
|
|
|
|
|
|
|
|
|
|
|
|
|
|
|
|
|
|
|
|
|
|
|
|
|
|
|
|
|
|
|
|
|
|
|
|
|
|
|
|
|
|
|
|
|
|
|
|
|
|
|
|
|
|
|
|
|
|
|
|
|
|
|
|
|
|
|
|
|
|
|
|
|
|
|
|
|
|
|
|
|
|
|
|
|
|
|
|
|
|
|
|
|
|
|
|
|
|
|
|
|
|
|
|
|
|
|
|
|
|
|
|
|
|
|
|
|
|
|
|
|
|
|
|
|
|
|
|
|
|
|
|
|
|
|
|
|
|
|
|
|
|
|
|
|
|
|
|
|
|
|
|
|
|
|
|
|
|
|
|
|
|
|
|
|
|
|
|
|
|
|
|
|
|
|
|
|
|
|
|
|
|
|
|
|
|
|
|
|
|
|
|
|
|
|
|
|
|
|
|
|
|
|
|
|
|
|
|
|
|
|
|
|
|
|
|
|
|
|
|
|
|
|
|
|
|
|
|
|
|
|
|
|
|
|
|
|
|
|
|
|
|
|
|
|
|
|
|
|
|
|
|
|
|
|
|
|
|
|
|
|
|
|
|
|
|
|
|
|
|
|
|
|
|
|
|
|
|
|
|
|
|
|
|
|
|
|
|
|
|
|
|
|
|
|
|
|
|
|
|
|
|
|
|
|
|
|
|
|
|
|
|
|
|
|
|
|
|
|
|
|
|
|
|
|
|
|
|
|
|
|
|
|
|
|
|
|
|
|
|
|
|
|
|
|
|
|
|
|
|
|
|
|
|
|
|
|
|
|
|
|
|
|
|
|
| Clearly-defined
numerical goals are needed to track future progress in restoring White Pond
to its highest potential. |
|
|
| Restoration
goals for high-quality water bodies are typically based upon anti-degradation
concepts. |
|
|
|
| The objective
is to provide future water quality that is at least as good as that observed
historically (1999 - 2005 ). |
|
|
| Summer-average
Secchi Depths in Walden Pond ranged from ~ 4 to 6 meters in 1997-1999. |
|
|
|
|
| Transparency
provides a practical surrogate for other water quality problems triggered by
nutrient and sediment loads. |
|
| An analogous
restoration goal for fish habitat could be developed based upon the
historical temperature & oxygen data. |
|
|
|
|
|
|
|
|
|
|
|
|
|
|
|
|
|
|
|
|
|
|
|
|
|
|
|
|
|
|
|
|
|
|
|
|
|
|
|
|
|
|
|
|
|
|
|
|
|
|
|
|
|
|
|
|
|
|
|
|
|
|
|
|
|
|
|
|
|
|
|
|
|
|
|
|
|
|
|
|
|
|
|
|
|
|
|
|
|
|
|
|
|
|
|
|
|
|
|
|
|
|
|
|
|
|
|
|
|
|
|
|
|
|
|
|
|
|
|
|
|
|
|
|
|
|
|
|
|
|
|
|
|
|
|
|
|
|
|
|
|
|
|
|
|
|
|
|
|
|
|
|
|
|
|
|
|
|
|
|
|
|
|
|
|
|
|
|
|
|
|
|
|
|
|
|
|
|
|
|
|
|
|
|
|
|
|
|
|
|
|
|
|
|
|
|
|
|
|
|
|
|
|
|
|
|
|
|
|
|
|
|
|
|
|
|
|
|
|
|
|
|
|
|
|
|
|
|
|
|
|
|
|
|
|
|
|
|
|
|
|
|
|
|
|
|
|
|
|
|
|
|
|
|
|
|
|
|
|
|
|
|
|
|
|
|
|
|
|
|
|
|
|
|
|
|
|
|
|
|
|
|
|
|
|
|
|
|
|
|
|
|
|
|
|
|
|
|
|
|
|
|
|
|
|
|
|
|
|
|
|
|
|
|
|
|
|
|
|
|
|
|
|
|
|
|
|
|
|
|
|
|
|
|
|
|
|
|
|
|
|
|
|
|
|
|
|
|
|
|
|
|
|
|
|
|
|
|
|
|
|
|
|
|
|
|
|
|
|
|
|
|
|
|
|
|
|
|
|
|
|
|
|
|
|
|
|
|
|
|
|
|
|
|
|
|
|
|
|
|
|
|
|
|
|
|
|
|
|
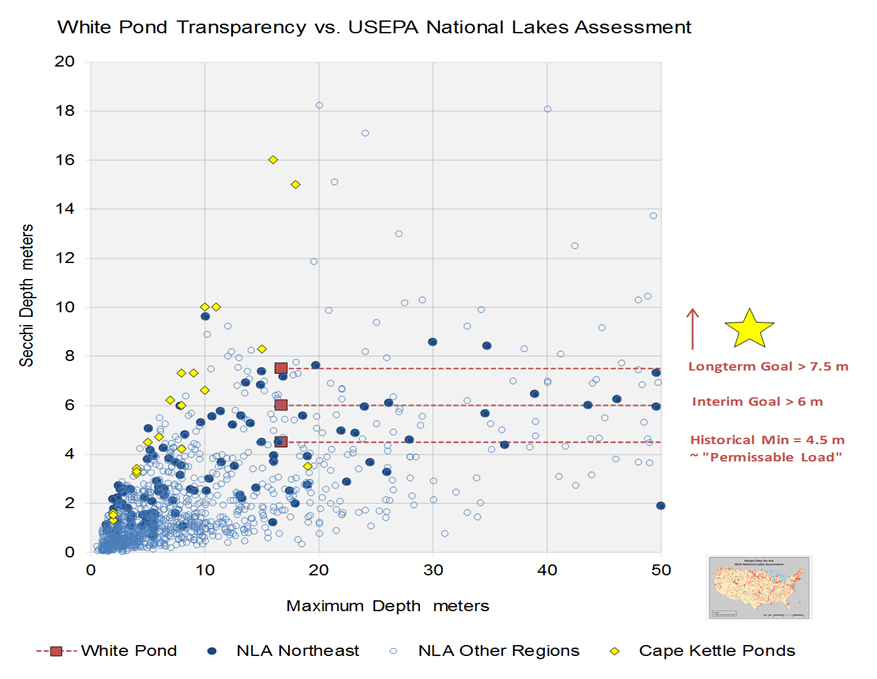
| USEPA National
Lakes Assessment, 2007, Random Sample of 1092 Lakes ( 106 in Northeast, EPA
Regions 1 & 2 ) |
|
|
| http://water.epa.gov/type/lakes/lakessurvey_index.cfm |
|
|
|
|
|
|
|
| Cape Cod
National Seashore Kettle Ponds (April Data). |
http://www.nps.gov/caco/naturescience/upload/Pondatlasfinal.pdf |
|
|
|
|
|
|
|
|
|
|
|
|
|
| White Pond,
June-August Means, 1987-2014 |
|
Percentile Relative to Other Lakes |
|
|
|
|
|
|
|
|
Depth
> 10 meters |
All
Lakes |
|
|
| Value |
Description |
|
Observed in Years |
USA |
Northeast |
USA |
Northeast |
|
|
| >7.5 m |
Proposed Long-term Goal |
2003 - 2005 |
90% |
91% |
97% |
96% |
|
|
| > 6 m |
Proposed Interim Goal |
|
1999 - 2005 |
80% |
74% |
93% |
89% |
|
|
| 4.5 m |
Min ~ "Permissable Load" |
1987, 2006, 2009, 2010,
2012 |
66% |
45% |
88% |
72% |
|
|
|
|
|
|
|
|
|
|
|
|
|
|
| Analysis of Temperature & Dissolved Oxygen Profiles |
|
|
|
|
|
|
|
|
|
|
|
|
|
|
|
|
|
|
| Vertical temperature and dissolved oxygen profiles are important
diagnostic tools. They provide
indicators of long-term changes in water quality related to eutrophication
and climate change. They also provide
a basis for evaluating cold-water and warm-water fish habitat by comparisions
with relevant water quality criteria.
Depletion of oxygen from the bottom waters is a signal of increased
algal productivity and recycling of phosphorus from the bottom
sediments. Increasing trends in
surface water temperature have reduced fish habitat and increased the risk of
blue-green algal blooms.
Interpretation of profiles is complicated because of the multiple
dimensions involved (depth, season, & year). The profile data are also influenced by
short-term and long-term variations in weather, including air temperature,
wind velocity, and solar radiation. |
|
|
|
|
|
|
|
|
|
|
|
|
|
| Comparisions of dissolved oxygen & temperature profiles
collected in 2011-2017 are displayed for separate months. This provides a basis for evaluating
long-term trends while normalizing for seasonal effects. |
|
| Detailed
results are shown in the attached figures for: |
June |
July |
August |
|
|
|
|
|
|
|
|
|
|
|
|
|
|
|
|
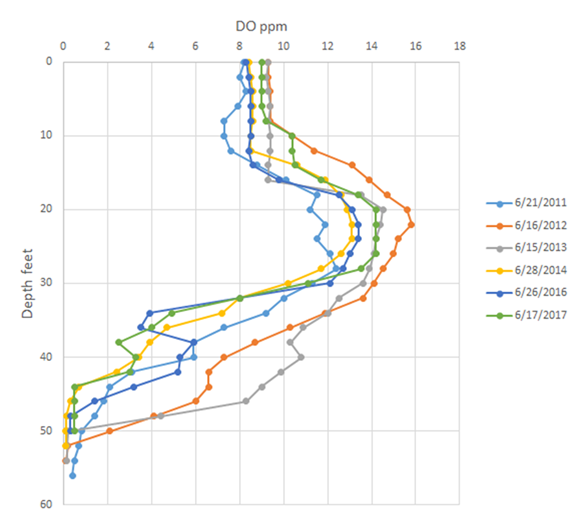
| The following figure shows vertical dissolved oxygen profiles
collected in June of 2011-2017.
Dissolved oxygen levels below 30 feet were significantly lower in
2014-2017, as compared with 2011-2013.
This is a symptom of increasing decomposition of organic material
derived from algal growth and accumulating in the bottom sediments. |
|
|
|
|
|
|
|
|
|
|
|
|
|
|
|
|
|
|
|
|
|
|
|
|
|
|
|
|
|
|
|
|
|
|
|
|
|
|
|
|
|
|
|
|
|
|
|
|
|
|
|
|
|
|
|
|
|
|
|
|
|
|
|
|
|
|
|
|
|
|
|
|
|
|
|
|
|
|
|
|
|
|
|
|
|
|
|
|
|
|
|
|
|
|
|
|
|
|
|
|
|
|
|
|
|
|
|
|
|
|
|
|
|
|
|
|
|
|
|
|
|
|
|
|
|
|
|
|
|
|
|
|
|
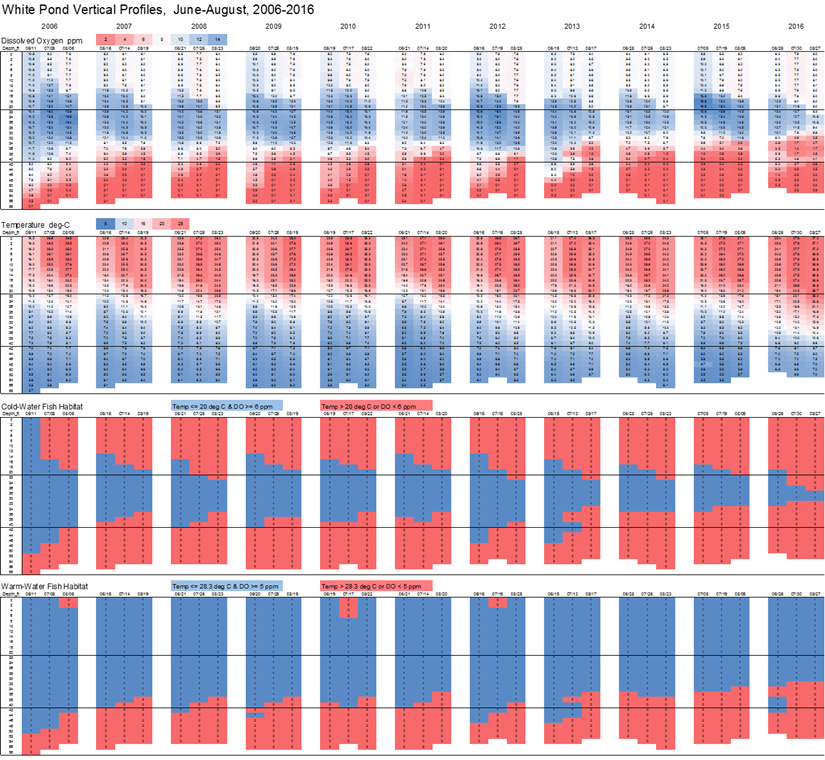
| Data from 2006-2017 displayed in a 3-Dimensional format
below. The vertical axis is water
depth in feet. The horizontal axis is
sampling date. The colors reflect
different levels of dissolved oxygen, temperature, and fish habitat
zones. The Massachusetts water
quality criteria for cold-water fish are a maximum temperature of 20 deg-C
and minimum dissolved oxygen concentration of 6 ppm. The criteria for warm-water fish are 28.3
deg-C and 5 ppm, respectively. Blue
symbols represent depth intervals and dates when the oxygen temperature
values conform to these criteria for each fish category. |
|
| Criteria
reference: |
http://www.mass.gov/eea/docs/dep/service/regulations/314cmr04.pdf |
|
|
|
|
|
|
|
|
|
|
|
|
|
|
|
|
| The plots show that: |
|
| - Dissolved
oxygen in the lower waters has decreased in recent years. |
|
|
|
|
|
| - Temperatures
have increased in both the bottom and surface waters. |
|
|
|
|
|
| - Fish habitat has decreased, especially for cold-water
fish. |
|
|
|
|
|
|
|
|
|
|
|
|
|
|
|
|
|
|
|
|
|
|
|
|
|
|
|
|
|
|
|
|
|
|
|
|
|
|
|
|
|
|
|
|
|
|
|
|
|
|
|
|
|
|
|
|
|
|
|
|
|
|
|
|
|
|
|
|
|
|
|
|
|
|
|
|
|
|
|
|
|
|
|
|
|
|
|
|
|
|
|
|
|
|
|
|
|
|
|
|
|
|
|
|
|
|
|
|
|
|
|
|
|
|
|
|
|
|
|
|
|
|
|
|
|
|
|
|
|
|
|
|
|
|
|
|
|
|
|
|
|
|
|
|
|
|
|
|
|
|
|
|
|
|
|
|
|
|
|
|
|
|
|
|
|
|
|
|
|
|
|
|
|
|
|
|
|
|
|
|
|
|
|
|
|
|
|
|
|
|
|
|
|
|
|
|
|
|
|
|
|
|
|
|
|
|
|
|
|
|
|
|
|
|
|
|
|
|
|
|
|
|
|
|
|
|
|
|
|
|
|
|
|
|
|
|
|
|
|
|
|
|
|
|
|
|
|
|
|
|
|
|
|
|
|
|
|
|
|
|
|
|
|
|
|
|
|
|
|
|
|
|
|
|
|
|
|
|
|
|
|
|
|
|
|
|
|
|
|
|
|
|
|
|
|
|
|
|
|
|
|
|
|
|
|
|
|
|
|
|
|
|
|
|
|
|
|
|
|
|
|
|
|
|
|
|
|
|
|
|
|
|
|
|
|
|
|
|
|
|
|
|
|
|
|
|
|
|
|
|
|
|
|
|
|
|
|
|
|
|
|
|
|
|
|
|
|
|
|
|
|
|
|
|
|
|
|
|
|
|
|
|
|
|
|
|
|
|
|
|
|
|
|
|
|
|
|
|
|
|
|
|
|
|
|
|
|
|
|
|
|
|
|
|
|
|
|
|
|
|
|
|
|
|
|
|
|
|
|
|
|
|
|
|
|
|
|
|
|
|
|
|
|
|
|
|
|
|
|
|
|
|
|
|
|
|
|
| PDF Version |
|
|
|
|
|
|
|
|
|
|
|
|
|
|
|
|
|
|
|
|
|
|
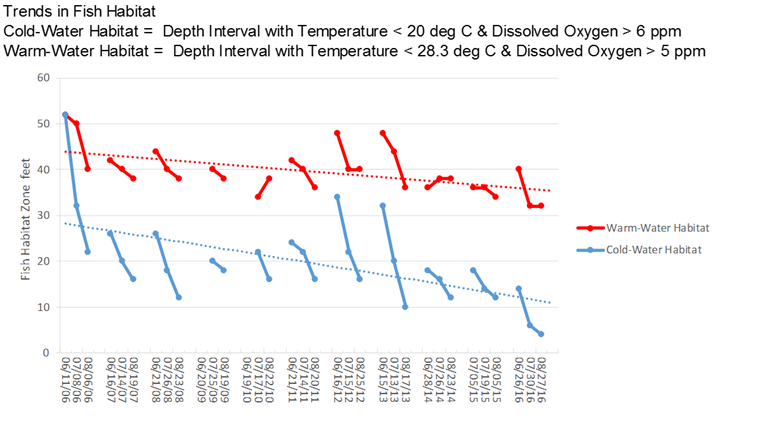
| Results for each profile can be summarized as depth intervals
conforming to various criteria. This
allows display of the data in a simpler time-series format. The following charts show long-term trends
in fish habitat, dissolved oxygen, and temperature based upon profiles
collected in June-August of 2006-2016.
A number of factors may contribute to these trends, including
accumulation and recycling of nutrients within the pond, climate change
triggering increasing water temperatures, decreases in water depth, and
antecedent weather conditions. |
|
|
|
|
|
|
|
|
|
|
|
|
|
|
|
|
|
|
|
|
|
|
|
|
|
|
|
|
|
|
|
|
|
|
|
|
|
|
|
|
|
|
|
|
|
|
|
|
|
|
|
|
|
|
|
|
|
|
|
|
|
|
|
|
|
|
|
|
|
|
|
|
|
|
|
|
|
|
|
|
|
|
|
|
|
|
|
|
|
|
|
|
|
|
|
|
|
|
|
|
|
|
|
|
|
|
|
|
|
|
|
|
|
|
|
|
|
|
|
|
|
|
|
|
|
|
|
|
|
|
|
|
|
|
|
|
|
|
|
|
|
|
|
|
|
|
|
|
|
|
|
|
|
|
|
|
|
|
|
|
|
|
|
|
|
|
|
|
|
|
|
|
|
|
|
|
|
|
|
|
|
|
|
|
|
|
|
|
|
|
|
|
|
|
|
|
|
|
|
|
|
|
|
|
|
|
|
|
|
|
|
|
|
|
|
|
|
|
|
|
|
|
|
|
|
|
|
|
|
|
|
|
|
|
|
|
|
|
|
|
|
|
|
|
|
|
|
|
|
|
|
|
|
|
|
|
|
|
|
|
|
|
|
|
|
|
|
|
|
|
|
|
|
|
|
|
|
| The fish habitat zone is defined as the depth interval
conforming to the oxygen and temperature criteria for each fish
category. For example, a value of 20
feet indicates that 20 out of the total ~50 feet represents suitable
habitat.The habitat zone varies seasonally because of increasing temperatures
and decreasing oxygen concentrations between June and August. While fish may survive for brief periods
outside of the habitat zones, reproduction would be inhibited. |
|
|
|
|
|
|
|
|
|
|
|
|
|
| The June-August average habitat zone for cold-water fish
decreased from ~28 feet in 2006 to ~12 feet in 2016. The monthly average habitat zone for
cold-water fish reached a historic low level of 4 feet in August of
2016. This has important implications
for fisheries management. The routine
practice of trout stocking should be reconsidered in light of the declining
trend in habitat. Unless the stocked
trout are harvested by fishermen, they would represent a significant source
of nutrients that further increase eutrophication of the pond. Death of unharvested fish triggered by
stressful habitat (particularly in August), settling of the fish carcass to
the bottom waters, and subsequent decomposition would further aggravate the
low dissolved oxygen levels and increase phosphorus recycling. |
|
|
|
|
|
|
|
|
|
|
|
|
|
| The warm-water fish habitat zone is larger than the cold-water
zone because of greater tolerance for high temperatures and low dissolved
oxygen concentrations. The
June-August habitat zone for warm-water fish decreased from ~44 feet in 2006
to ~35 feet in 2016. The monthly
average habitat zone for warm-water fish reached a historic low level of 32
feet in August of 2016. |
|
|
|
|
|
|
|
|
|
|
|
|
|
|
|
|
|
|
|
|
|
|
|
|
|
|
|
|
|
|
|
|
|
|
|
|
|
|
|
|
|
|
|
|
|
|
|
|
|
|
|
|
|
|
|
|
|
|
|
|
|
|
|
|
|
|
|
|
|
|
|
|
|
|
|
|
|
|
|
|
|
|
|
|
|
|
|
|
|
|
|
|
|
|
|
|
|
|
|
|
|
|
|
|
|
|
|
|
|
|
|
|
|
|
|
|
|
|
|
|
|
|
|
|
|
|
|
|
|
|
|
|
|
|
|
|
|
|
|
|
|
|
|
|
|
|
|
|
|
|
|
|
|
|
|
|
|
|
|
|
|
|
|
|
|
|
|
|
|
|
|
|
|
|
|
|
|
|
|
|
|
|
|
|
|
|
|
|
|
|
|
|
|
|
|
|
|
|
|
|
|
|
|
|
|
|
|
|
|
|
|
|
|
|
|
|
|
|
|
|
|
|
|
|
|
|
|
|
|
|
|
|
|
|
|
|
|
|
|
|
|
|
|
|
|
|
|
|
|
|
|
|
|
|
|
|
|
|
|
|
|
|
|
|
|
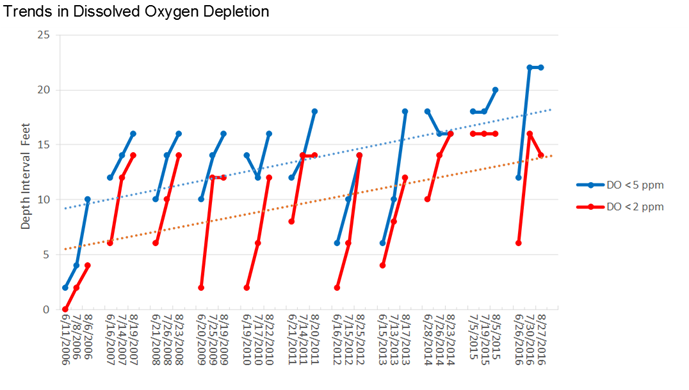
| Trends in oxygen depletion are expressed as depth intervals with
oxygen levels below 5 ppm and 2 ppm.
Both exhibited increasing trends over the 2006-2016 period. |
|
|
| The 5 ppm threshold reflects habitat unsuitable for warm-water
fish. This seasonal-average depth
interval below 5 ppm increased from ~9 feet in 2006 to ~18 feet in 2016. The monthly-average interval reached an
historic maximum of 22 feet in July-August of 2016. |
|
|
| Dissolved oxygen levels below 2 ppm reflect conditions lethal to
most fish and an increased risk of phosphorus recycling from the bottom
sediments. An increase in the depth
interval with DO below 2 ppm implies an expansion of the bottom sediment area
releasing phosphorus to the water column.
The seasonal-average depth interval with DO below 2 ppm increased from
~6 feet in 2006 to ~14 feet in 2016.
The monthly-average depth interval reached an historic maximum of 16
feet in August 2014, June-August 2015, and July 2016. |
|
|
|
|
|
|
|
|
|
|
|
|
|
|
|
|
|
|
|
|
|
|
|
|
|
|
|
|
|
|
|
|
|
|
|
|
|
|
|
|
|
|
|
|
|
|
|
|
|
|
|
|
|
|
|
|
|
|
|
|
|
|
|
|
|
|
|
|
|
|
|
|
|
|
|
|
|
|
|
|
|
|
|
|
|
|
|
|
|
|
|
|
|
|
|
|
|
|
|
|
|
|
|
|
|
|
|
|
|
|
|
|
|
|
|
|
|
|
|
|
|
|
|
|
|
|
|
|
|
|
|
|
|
|
|
|
|
|
|
|
|
|
|
|
|
|
|
|
|
|
|
|
|
|
|
|
|
|
|
|
|
|
|
|
|
|
|
|
|
|
|
|
|
|
|
|
|
|
|
|
|
|
|
|
|
|
|
|
|
|
|
|
|
|
|
|
|
|
|
|
|
|
|
|
|
|
|
|
|
|
|
|
|
|
|
|
|
|
|
|
|
|
|
|
|
|
|
|
|
|
|
|
|
|
|
|
|
|
|
|
|
|
|
|
|
|
|
|
|
|
|
|
|
|
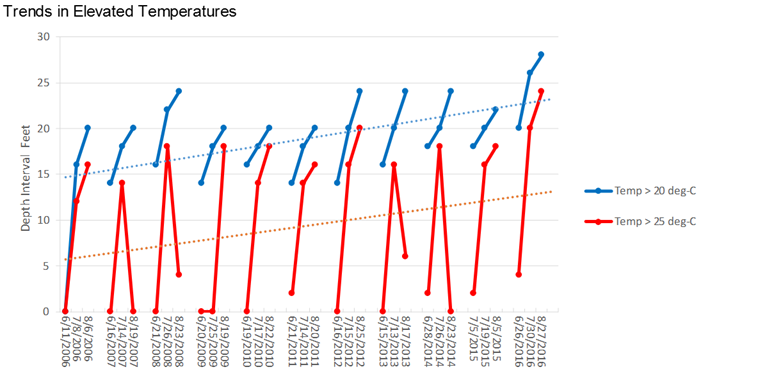
| Trends in temperature are expressed as depth intervals with
temperatures exceeding 20 and 25 deg-C.
Both exhibited increasing trends over the 2006-2016 period. It is likely that these trends reflect
increasing air temperatures and declining water depths. |
|
|
| The 20 deg temperature threshold reflects habitat unsuitable for
cold-water fish. This seasonal-average
depth interval exceeding 20 deg-C increased from ~14 feet in 2006 to ~23 feet
in 2016. The monthly-average depth
interval reached an historical maximum of 28 feet in August 2016. |
|
|
| The 25 deg threshold reflects conditions conducive to high algal
growth rates and increased dominance of blue-green algae over other
species. The seasonal-average depth
interval exceeding 25 deg C increased from 6 feet in 2006 to 13 feet in
2016. The monthly-average depth
interval reached an historic maximum of 29 feet in August 2016. |
|
|
| It is likely that the relatively hot and dry summer of 2016
contributed to the elevated temperatures measured in the Pond. |
|
|
|
|
|
|
|
|
|
|
|
|
|
|
| Phosphorus Data |
|
|
|
|
|
|
|
|
|
|
|
|
|
|
|
|
|
|
|
|
|
|
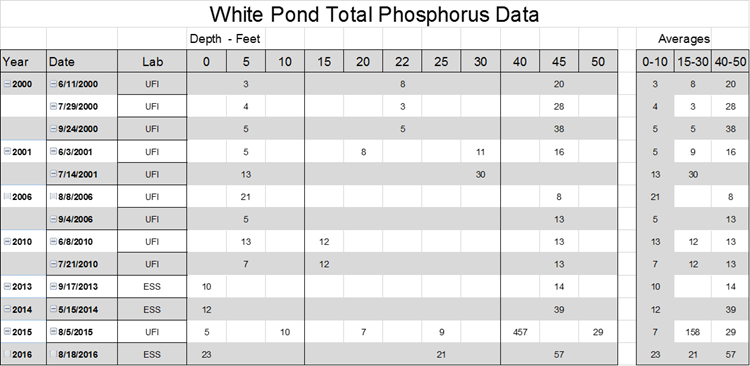
| Phosphorus data collected since 2000 are summarized in the table
below. This includes analyses of
samples collected by the Friends of White Pond and analyzed by Upstate
Freshwater Institute (UFI), as well as data collected by ESS under contract
with the Town of Concord. Because of
the high varibility in phosphorus measurements, at least three vertical
profiles are typically collected to adequately assess trophic status and long-term
trends. While the data are limited,
phosphorus levels in 2014-2016 were higher than those measured in previous
years, particularly at depths below 15 feet, where average concentrations
ranged from 3 to 38 ppb in 2000-2013, as compared with 21 to 158 ppb in
2014-2016. This is a symptom of
increased phosphorus release from the bottom sediments. Addressing this nutrient source, as well
as watershed runoff and erosion, is required to restore the Pond. |
|
|
|
|
|
|
|
|
|
|
|
|
|
|
|
|
|
|
|
|
|
|
|
|
|
|
|
|
|
|
|
|
|
|
|
|
|
|
|
|
|
|
|
|
|
|
|
|
|
|
|
|
|
|
|
|
|
|
|
|
|
|
|
|
|
|
|
|
|
|
|
|
|
|
|
|
|
|
|
|
|
|
|
|
|
|
|
|
|
|
|
|
|
|
|
|
|
|
|
|
|
|
|
|
|
|
|
|
|
|
|
|
|
|
|
|
|
|
|
|
|
|
|
|
|
|
|
|
|
|
|
|
|
|
|
|
|
|
|
|
|
|
|
|
|
|
|
|
|
|
|
|
|
|
|
|
|
|
|
|
|
|
|
|
|
|
|
|
|
|
|
|
|
|
|
|
|
|
|
|
|
|
|
|
|
|
|
|
|
|
|
|
|
|
|
|
|
|
|
|
|
|
|
|
|
|
|
|
|
|
|
|
|
|
|
|
|
|
|
|
|
|
|
|
|
|
|
|
|
|
|
|
|
|
|
|
|
|
|
|
|
|
| Potential Remedy for Sediment Phosphorus Releases |
|
|
|
|
|
|
|
|
|
|
|
|
|
|
|
|
|
|
| A recent issue of Lake and Reservoir Management, a publication
of the North American Lake Management Society, describes experience in
utilizing chemical treatment to address sediment phosphorus sources. |
|
|
| One article is
an overview of global experience. |
Wagner (2017) |
|
|
|
|
|
| Another
describes applications to ponds on Cape Cod. |
Wagner et al. (2017) |
|
|
|
|
|
|
|
|
|
|
|
|
|
|
|
|
|
| Preliminary cost estimates for applying this technology to White
Pond based upon the Wagner et al article are described below. |
|
|
| Alum (aluminum sulfate) is a chemical that is widely used for
treating drinking water, as well as for treating lake sediments to control
phosphorus releases. Cape Cod ponds
treated with alum ranged in total size from 19 to 731 acres, as compared with
White Pond area of 39 acres. Treatment
is typically targeted to the deeper water zones where oxygen is depleted and
sediment phosphorus levels are relatively high. Treated areas of Cape Cod ponds ranged
from 12 to 366 acres. |
|
|
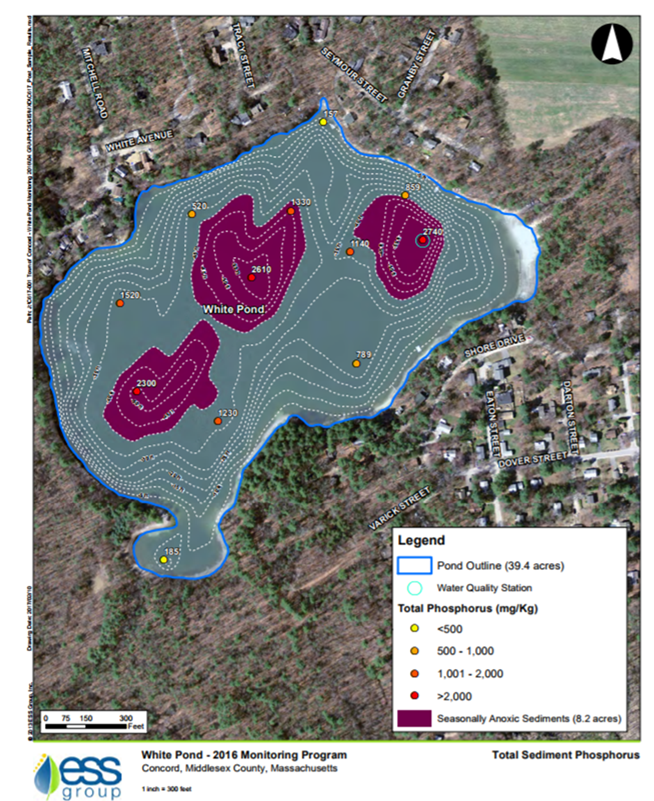
| In a recent report to the Town of Concord, ESS measured sediment
phosphorus concentrations ranging from 157 to 2,740 mg/kg at several
locations throughout the pond (see map below). The highest values were located in the
three deep zones (2,300 - 2,740 mg/kg), as compared with a range of 157 to
1,520 mg/kg at other locations. Based
upon August 2016 oxygen profiles, ESS also estimated that the area of anoxic
sediments in the three deep zones was approximately 8.2 acres. If this were used as a basis for designing
an alum treatment of White Pond, the treated area would be small (8.2 acres),
relative to the treated areas in Cape Cod ponds (12 - 366 acres). |
|
|
| The cost of the Cape Cod treatments in 2016 dollars averaged
$150 per gram of alumimum applied per square meter per hectare of treated
area. Aluminum doses ranged from 10
to 100 grams per square meter. If
these cost factors were applied to an area of 8.2 acres, the cost for
treating White Pond would range from $4,980 to $49,798, or 5 to 50 K$. A feasibility study would be required to
provide more accurate estimates for the appropriate treatment area and
Aluminum dose. Treatments typically
require a state permit. |
|
|
|
|
|
|
|
|
|
|
|
|
|
|
| White Pond
Sediment Phosphorus and Anoxic Zones |
ESS, 2017 |
|
|
|
|
|
|
|
|
|
|
|
|
|
|
|
|
|
|
|
|
|
|
|
|
|
|
|
|
|
|
|
|
|
|
|
|
|
|
|
|
|
|
|
|
|
|
|
|
|
|
|
|
|
|
|
|
|
|
|
|
|
|
|
|
|
|
|
|
|
|
|
|
|
|
|
|
|
|
|
|
|
|
|
|
|
|
|
|
|
|
|
|
|
|
|
|
|
|
|
|
|
|
|
|
|
|
|
|
|
|
|
|
|
|
|
|
|
|
|
|
|
|
|
|
|
|
|
|
|
|
|
|
|
|
|
|
|
|
|
|
|
|
|
|
|
|
|
|
|
|
|
|
|
|
|
|
|
|
|
|
|
|
|
|
|
|
|
|
|
|
|
|
|
|
|
|
|
|
|
|
|
|
|
|
|
|
|
|
|
|
|
|
|
|
|
|
|
|
|
|
|
|
|
|
|
|
|
|
|
|
|
|
|
|
|
|
|
|
|
|
|
|
|
|
|
|
|
|
|
|
|
|
|
|
|
|
|
|
|
|
|
|
|
|
|
|
|
|
|
|
|
|
|
|
|
|
|
|
|
|
|
|
|
|
|
|
|
|
|
|
|
|
|
|
|
|
|
|
|
|
|
|
|
|
|
|
|
|
|
|
|
|
|
|
|
|
|
|
|
|
|
|
|
|
|
|
|
|
|
|
|
|
|
|
|
|
|
|
|
|
|
|
|
|
|
|
|
|
|
|
|
|
|
|
|
|
|
|
|
|
|
|
|
|
|
|
|
|
|
|
|
|
|
|
|
|
|
|
|
|
|
|
|
|
|
|
|
|
|
|
|
|
|
|
|
|
|
|
|
|
|
|
|
|
|
|
|
|
|
|
|
|
|
|
|
|
|
|
|
|
|
|
|
|
|
|
|
|
|
|
|
|
|
|
|
|
|
|
|
|
|
|
|
|
|
|
|
|
|
|
|
|
|
|
|
|
|
|
|
|
|
|
|
|
|
|
|
|
|
|
|
|
|
|
|
|
|
|
|
|
|
|
|
|
|
|
|
|
|
|
|
|
|
|
|
|
|
|
|
|
|
|
|
|
|
|
| References |
|
|
|
|
|
|
|
|
|
|
|
|
|
|
|
|
|
|
|
|
|
|
| Google Group for Posting Information & Comments
on White Pond |
|
|
|
|
|
|
|
|
|
|
|
|
|
|
|
|
|
|
| Photo, Video, & Document Cache -
Google Drive |
|
|
|
|
|
|
|
|
|
|
|
|
|
|
|
|
|
|
|
| Reports
Prepared for Town of Concord, W. Walker et al. 1988-1991 |
|
| Baseline Report |
|
White Pond Preliminary Diagnostic
Study, January 1988. |
|
|
|
|
| Watershed &
Hydrogeology |
White Pond Water Quality Studies - 1988, July 1989. |
|
|
|
|
| Additional WQ
Monitoring |
White Pond Water Quality Studies -
1989, March 1990 |
|
|
|
|
| Shoreline
Groundwater Survey |
White Pond Water Quality Studies -
1990, April 1991. |
|
|
|
|
| Comments on
Unisys Land |
Water Quality Considerations - Proposed Purchase of
Unisys Land, April 1991. |
|
|
|
|
|
|
|
|
|
|
|
|
|
|
| Friends of
White Pond (FoWP) |
|
|
|
|
|
|
|
|
|
| FoWP Ponderings
Newsletter |
2015 |
2014 |
Index 1987-2015 |
|
All Issues |
|
|
|
| FoWP Lake Protection Project - Runoff Infiltration Basin at Boat Ramp,
1991 |
|
|
|
|
|
|
|
|
|
|
|
|
|
|
|
|
|
| Preserve
White Pond Web Site |
|
|
|
|
|
|
|
|
|
|
|
|
|
|
|
|
|
|
|
|
|
| Massachusetts
Water Quality Standards |
|
|
|
|
|
|
|
|
|
|
|
|
|
|
|
|
|
|
|
|
| USGS
Walden Pond Study - 2001 |
|
Poster |
|
|
|
|
|
|
|
|
|
|
|
|
|
|
|
|
|
|
|
| Bruce
Freeman Rail Trail |
|
|
|
|
|
|
|
|
|
|
|
|
|
|
|
|
|
|
|
|
|
| References on
Alum Treatments |
|
|
|
|
|
|
|
|
|
| Lake &
Reservoir Management, Volume 33, 2017 |
|
|
|
|
|
|
|
| Wagner (2017) |
Preface: Advances in Phosphorus Inactivation |
|
|
|
|
|
|
| Wagner et al. (2017) |
Aluminum treatment to control internal
phosphorus loading in lakes on Cape Cod, MA. |
|
|
|
|
|
|
|
|
|
|
|
|
|
|
| Ongoing
Development of a Watershed Management Plan for White Pond |
|
|
|
|
|
| Concord Department of Natural Resources |
|
|
|
|
|
|
|
|
| Agenda
for January 21, 2015 Town Forum |
|
|
|
|
|
|
|
|
| Final Management Plan - 2015 |
|
|
|
|
|
|
|
|
|
| Town
Request for Proposals |
|
|
|
|
|
|
|
|
|
| ESS
Preliminary Report - January 2014 |
|
|
|
|
|
|
|
|
| ESS Preliminary Findings Presentation - March 2014 |
|
|
|
|
|
|
|
| ESS Draft Report - October 2014 |
|
|
|
|
|
|
|
|
|
| ESS Response to Comments - December 2014 |
|
|
|
|
|
|
|
| ESS Interim Monitoring Report for 2016 - February 2017. |
|
|
|
|
|
|
|
|
|
|
|
|
|
|
|
|
|
|
|
| http://www.wwwalker.net/whitepond |
|
|
|
|
|
|
|
|
07/17/17 |
|
|
|
|
|
|
|
|
|
|
|
|